How it works
A SIP is a method of making regular investments, not a guaranteed-return product. Enter your existing savings, monthly contribution, effective annual return assumption and duration. We convert the annual return to an equivalent monthly factor, then model each deposit. An annual step-up takes effect after every twelve deposits. Beginning-of-month deposits receive one additional month of modeled growth. Today’s purchasing power is the final balance divided by (1 + inflation)^years. The fixed-plan comparison keeps the same starting capital, initial contribution and return, but no annual increase. A larger step-up balance includes more money contributed: it does not imply a better investment return.
i = (1 + R)^(1/12) − 1; D_m = D × (1 + s)^floor(m/12); B_next = B × (1 + i) + D_m (month-end)Worked example
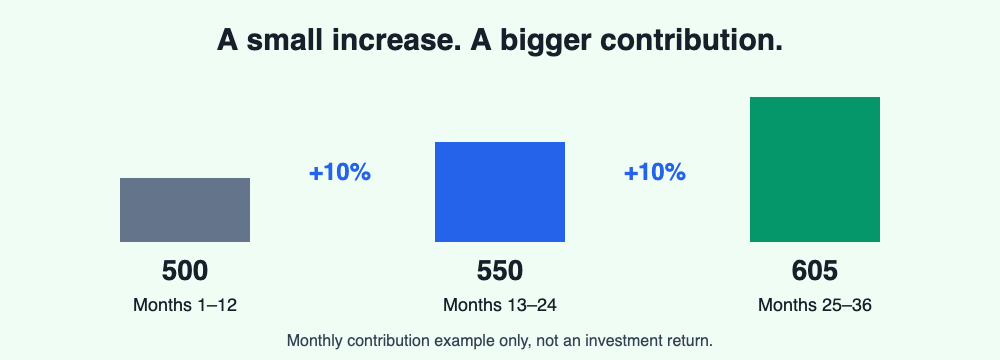
With no starting capital, 500 deposited at each month end for one year and a 0% return, the balance is 6,000. At 3% inflation its purchasing power is about 5,825.24 in today’s money. A 10% annual contribution increase starts with deposit 13 at 550; it does not change the first twelve deposits.
Frequently Asked Questions
Are these returns guaranteed?
No. A constant annual return is a mathematical assumption, not a promise. Real returns fluctuate and losses are possible.
Why not divide the annual return by twelve?
An effective annual return already includes compounding. Its monthly equivalent is (1 + R)^(1/12) − 1; dividing by twelve describes a different nominal-rate model.
When does the annual increase start?
After the first twelve contributions. Contributions 13 through 24 use the increased monthly amount; the next increase starts at contribution 25.
What does today’s purchasing power mean?
It discounts the projected balance by your assumed inflation rate. It is not a guaranteed future price level.
Does step-up outperform the fixed plan?
It contributes more money. Compare both paid-in capital and projected growth; a larger final balance alone is not evidence of a higher return rate.
Sources and scope
Sources checked on October 12, 2026. This is a calculation tool, not a fatwa or an independently certified religious review.